Measurement plan
A measurement plan helps you design and track who and how will collect information according to your list of impact indicators (with the help of using appropriate research methods).
What is it?
The measurement plan helps you keep track of your activities regarding impact measurement.
Essentially a combination of a calendar and checklist, it helps you first decide and then supervise who and how will collect information according to your list of impact indicators
The plan should be created before carrying out any impact measurement-related activities.
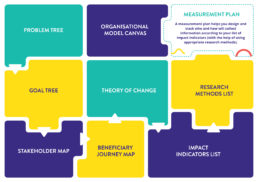
There are two interconnected tools: a big picture dashboard and an Excel example.
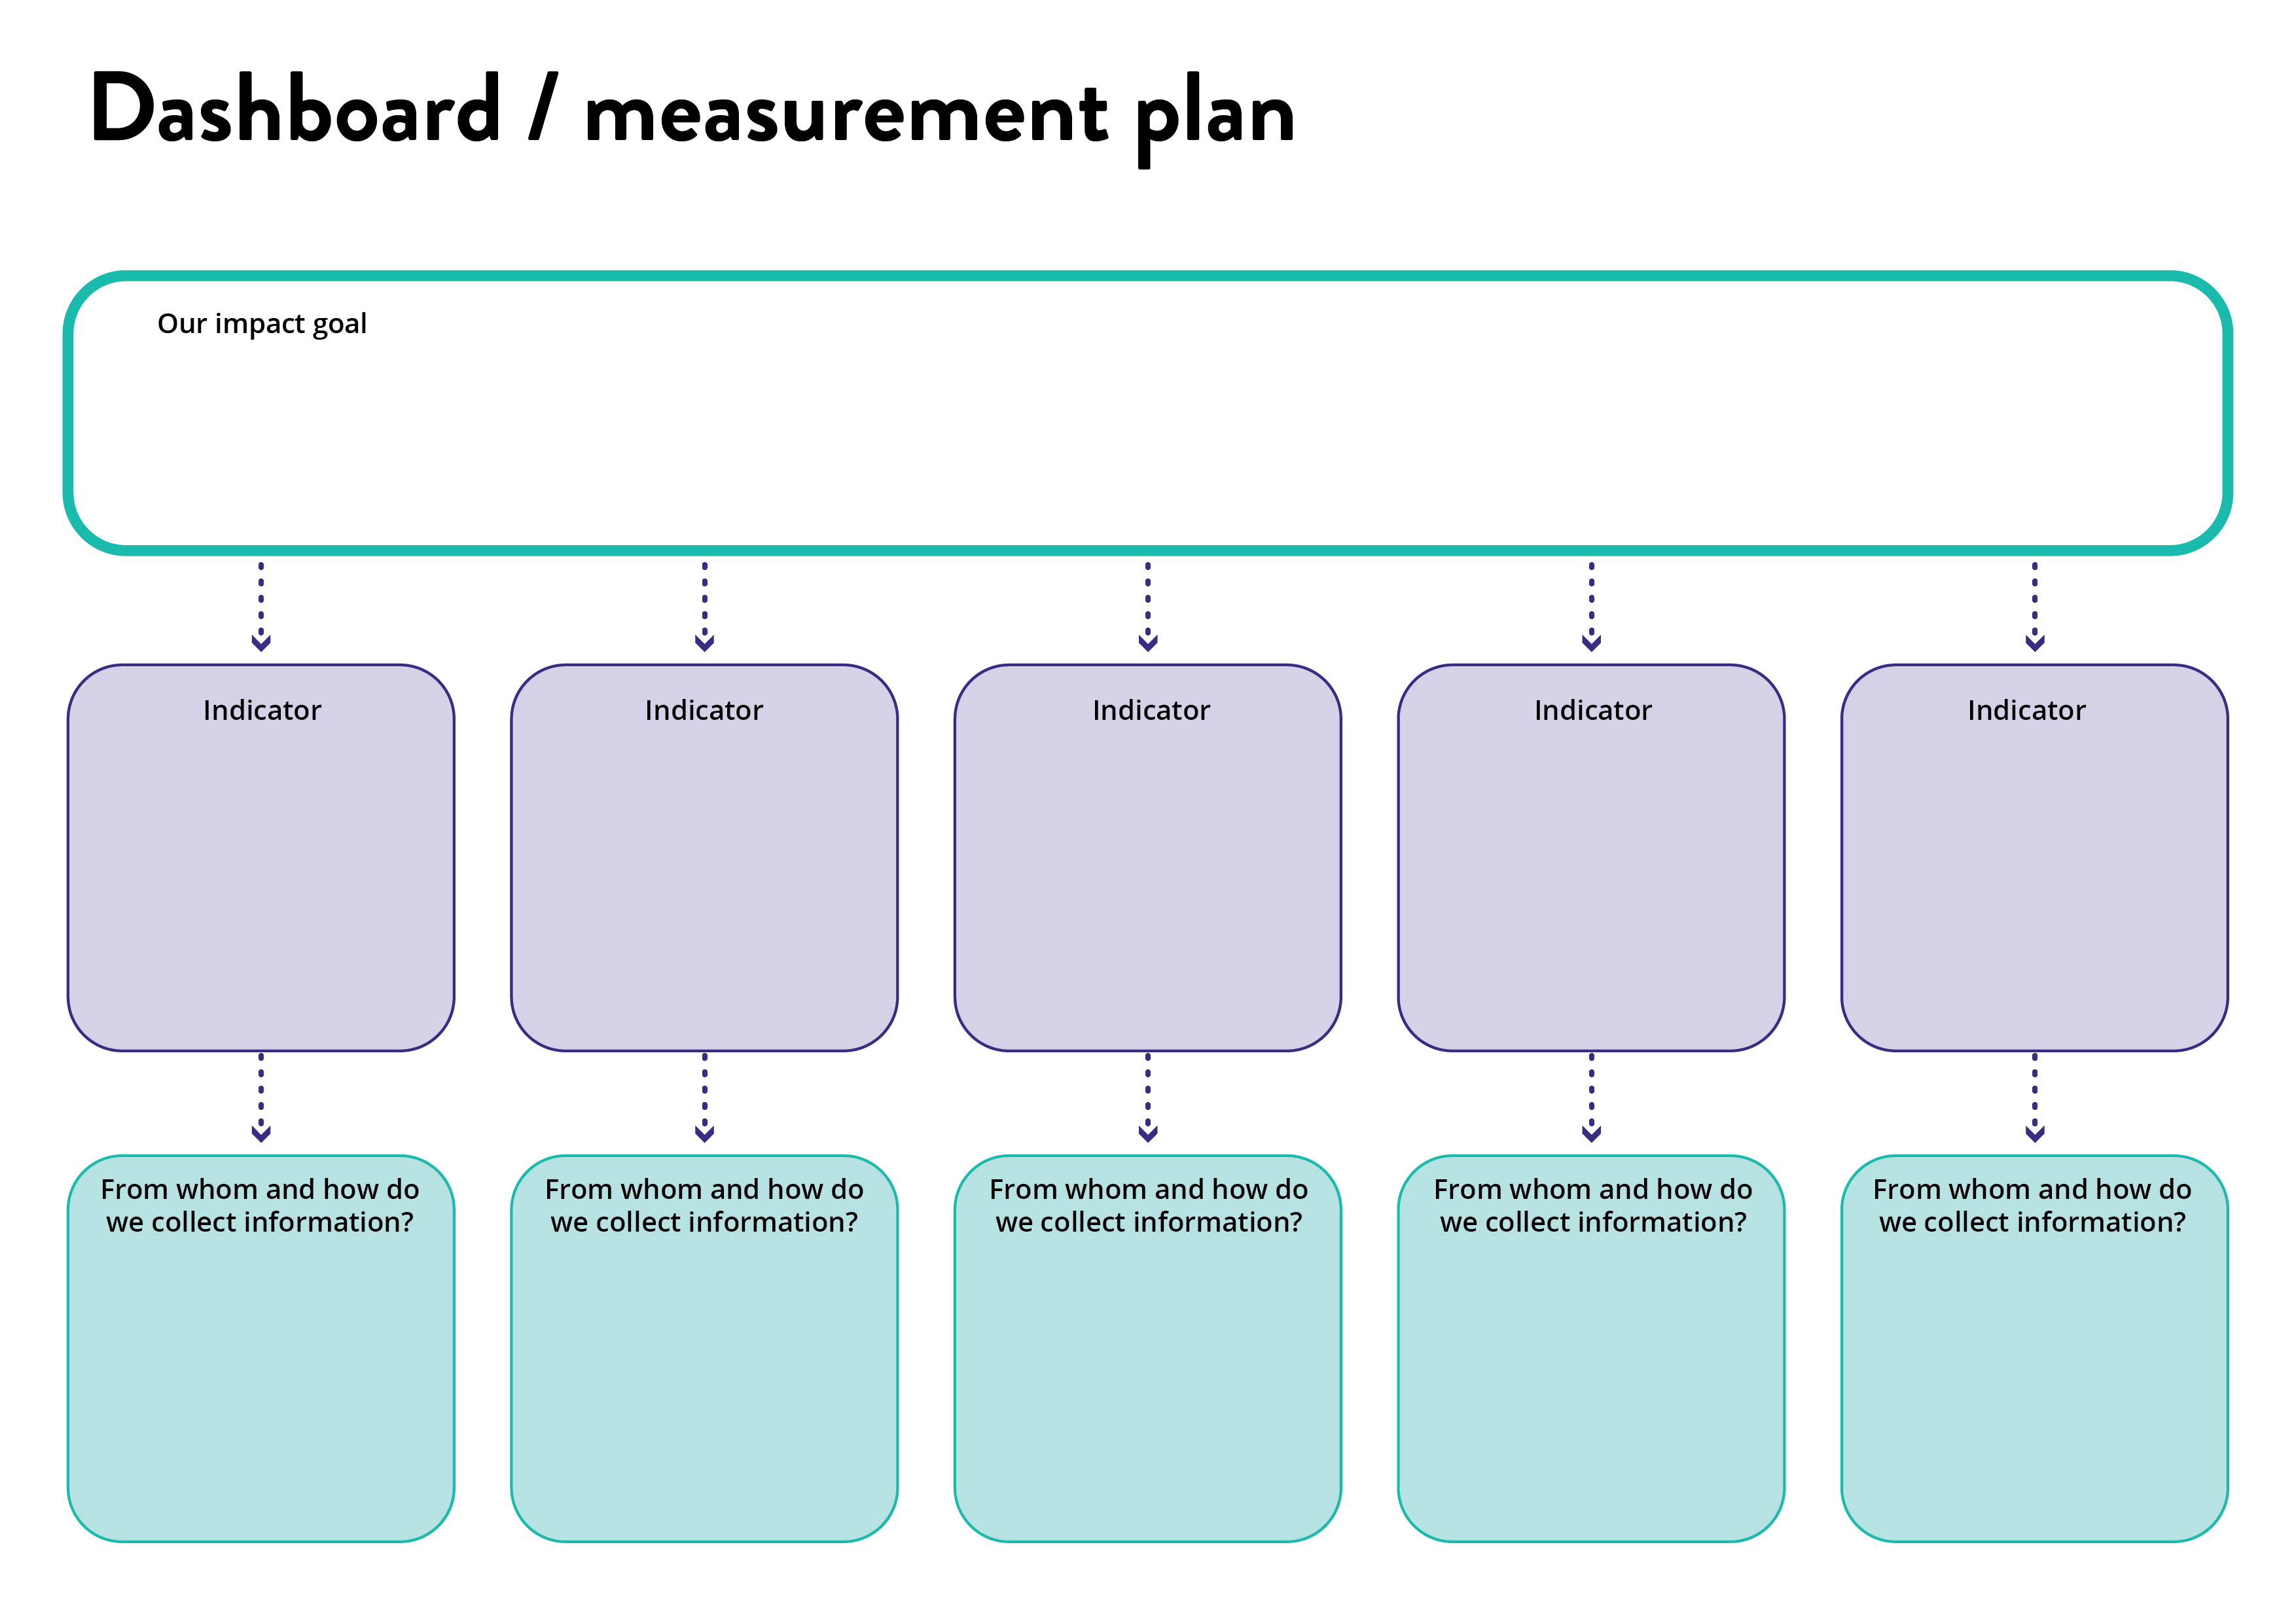
The measurement plan dashboard should be used to get started on planning. It helps you see a bigger picture, prioritize goals and indicators, decide on research methods.
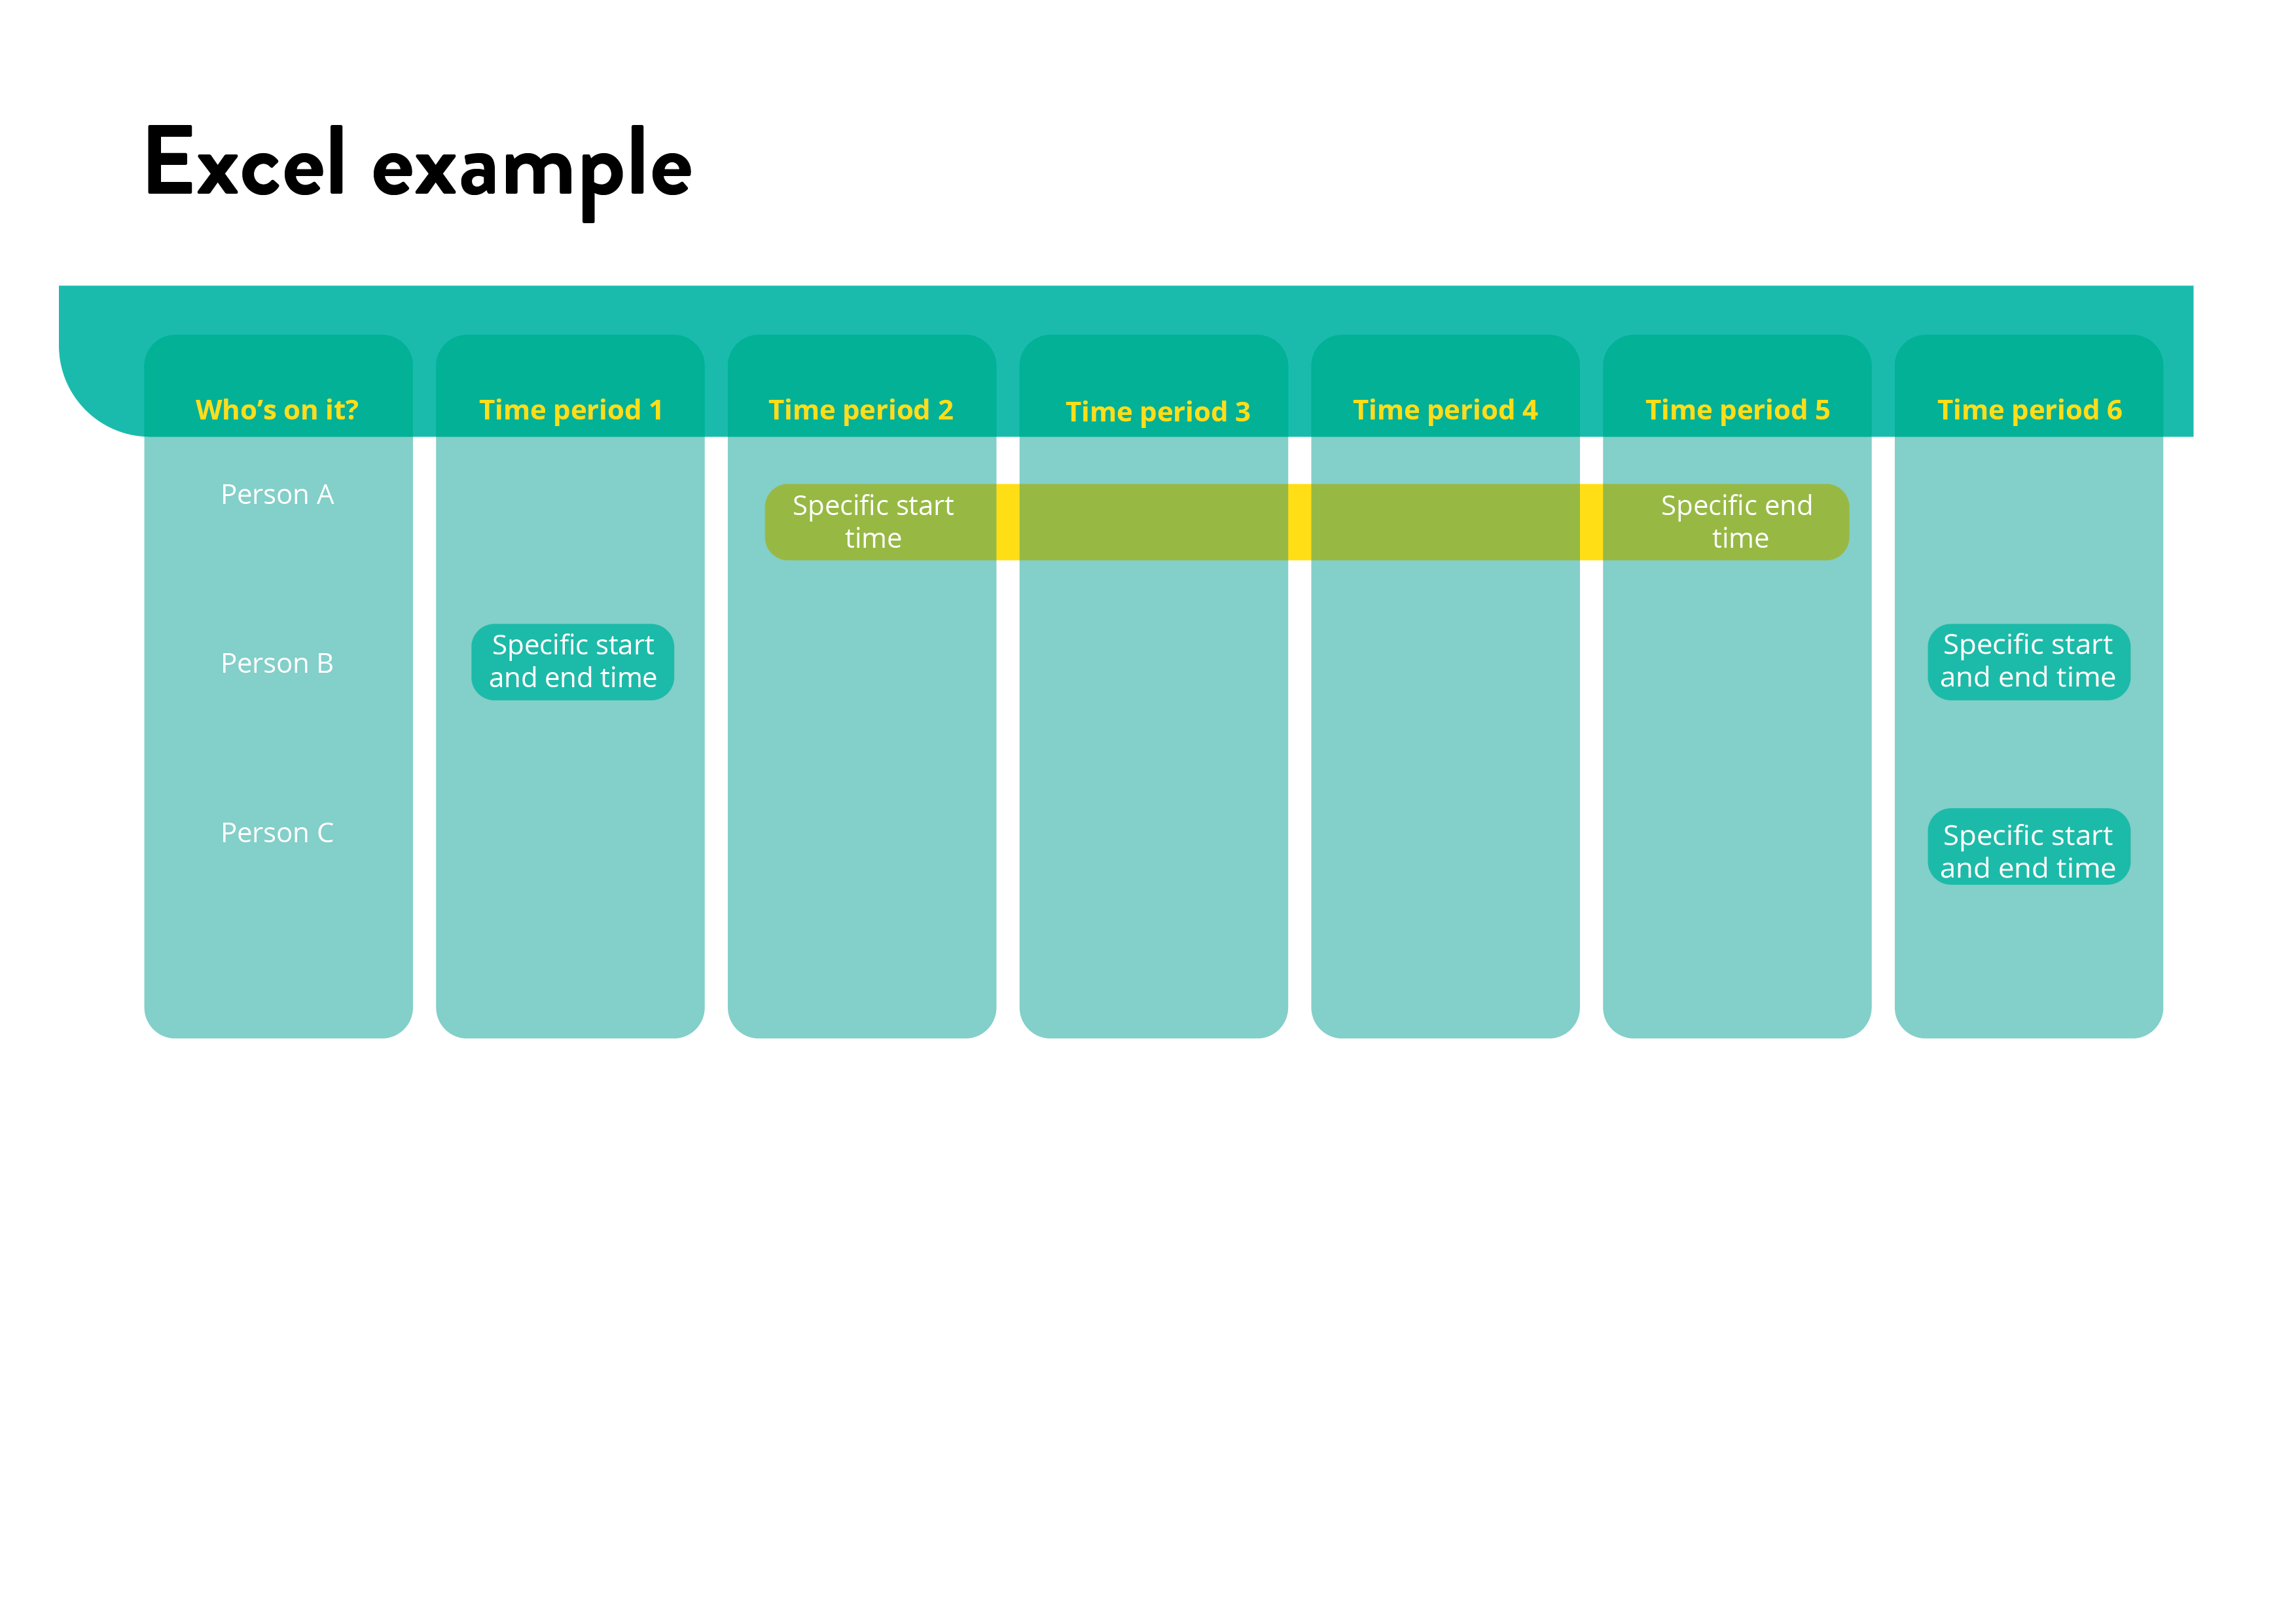
The Excel example, however, lets you make arrangements based on what you’re planning to measure. You can assign specific tasks to your team members and set deadlines for them.
But how are these two templates connected?
If you don’t yet have a clear idea of why, what, when and by whom impact measurement activities should be carried out, it’s good to use the dashboard first. Then, you can use the input of the dashboard to develop an Excel table for tracking your progress.
Nevertheless, you can use just one of them if you feel like such a choice would be a better fit for your organization.
Watch the video to get an idea of what the tool is about or continue reading after the video player.
In more detail…
Start with filling in the measurement plan dashboard.
1.Write down your impact goal – this is a goal from the goal tree template that you’re going to focus on. You may have more of them, but it’s easier to pick one goal at first to keep your focus (and create separate dashboards for other goals if necessary).
2.Think of which aspects of this goal you can (and want to) measure. You can use the impact indicators list template to generate ideas and categorize them. Add them to the dashboard as indicators.
3.For each indicator, add a method of collecting data accordingly. The research methods list can be useful here.
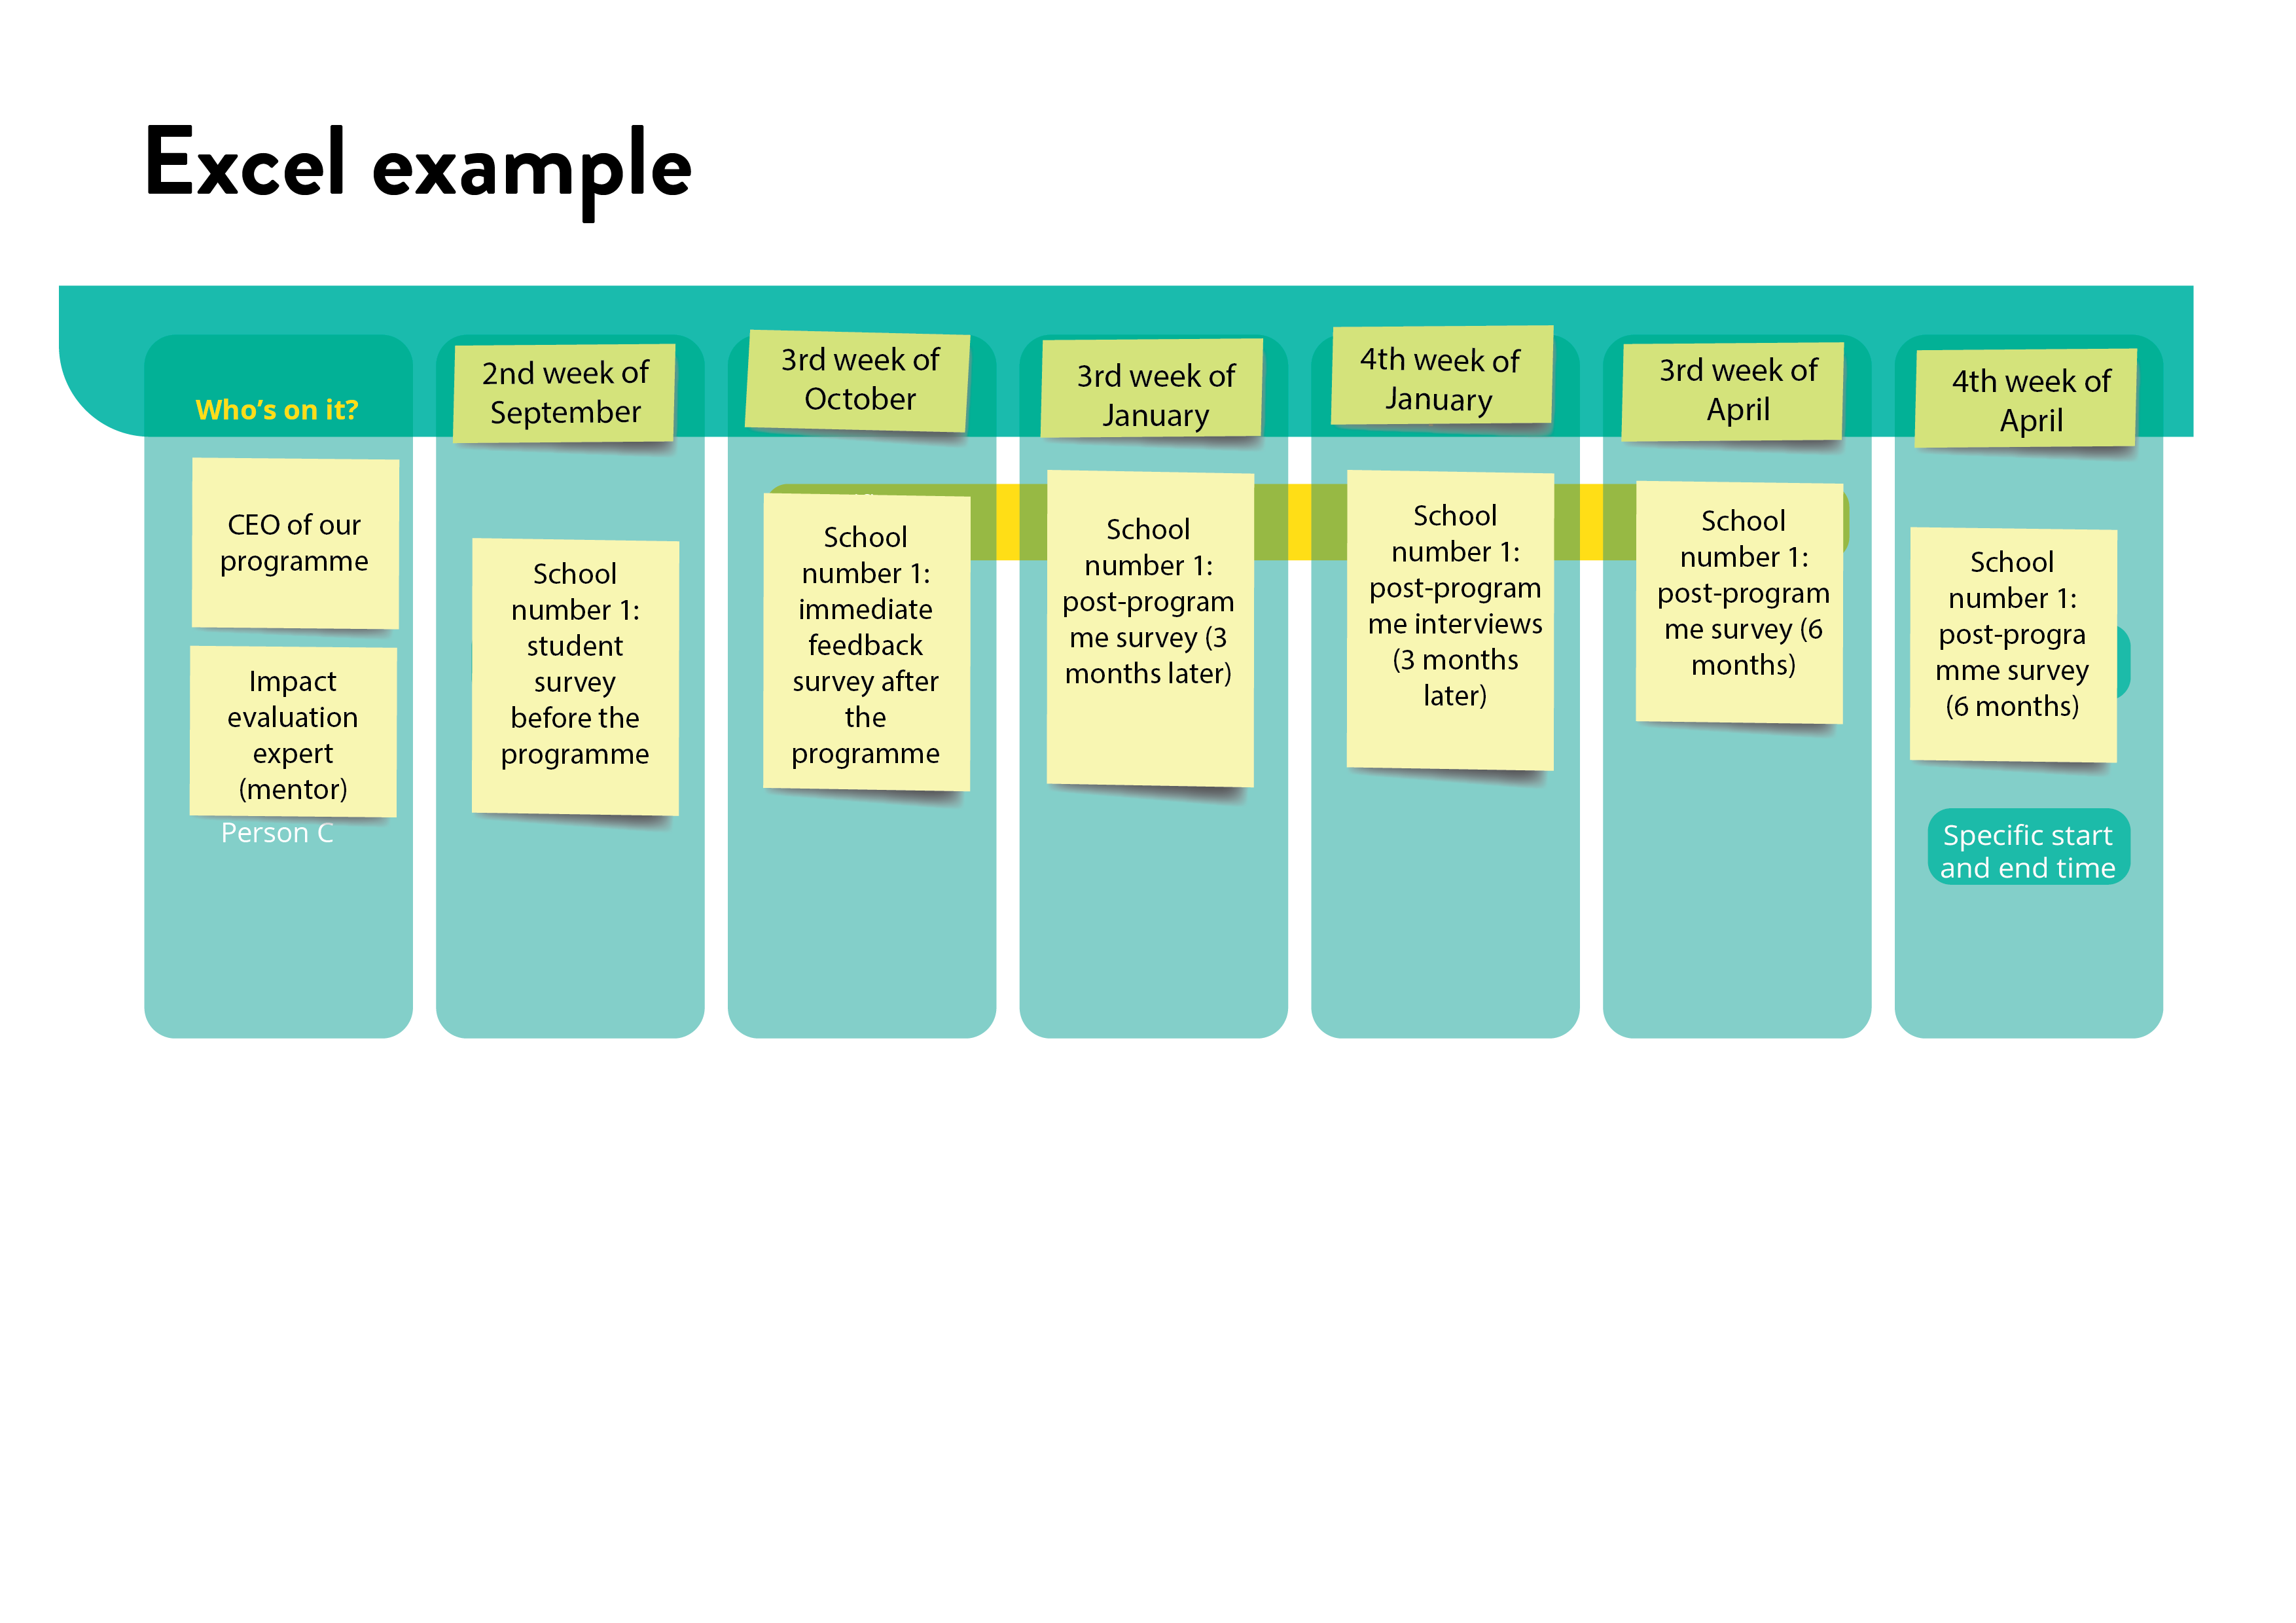
go more into detail with the Excel example
1.Write down your impact indicators from the dashboard, the research methods corresponding to them (check out the research methods list template for inspiration if necessary). Also, add:
- who and when will do the research;
- who and when will analyse the research results and take action based on the conclusions.
2.You can use whichever project management and time management tools you already have in your organisation. The templates – including this Excel template – just show you what the general structure could be.
3.Follow the plan. If needed, update (e.g. dates) or change (e.g. methods) it.
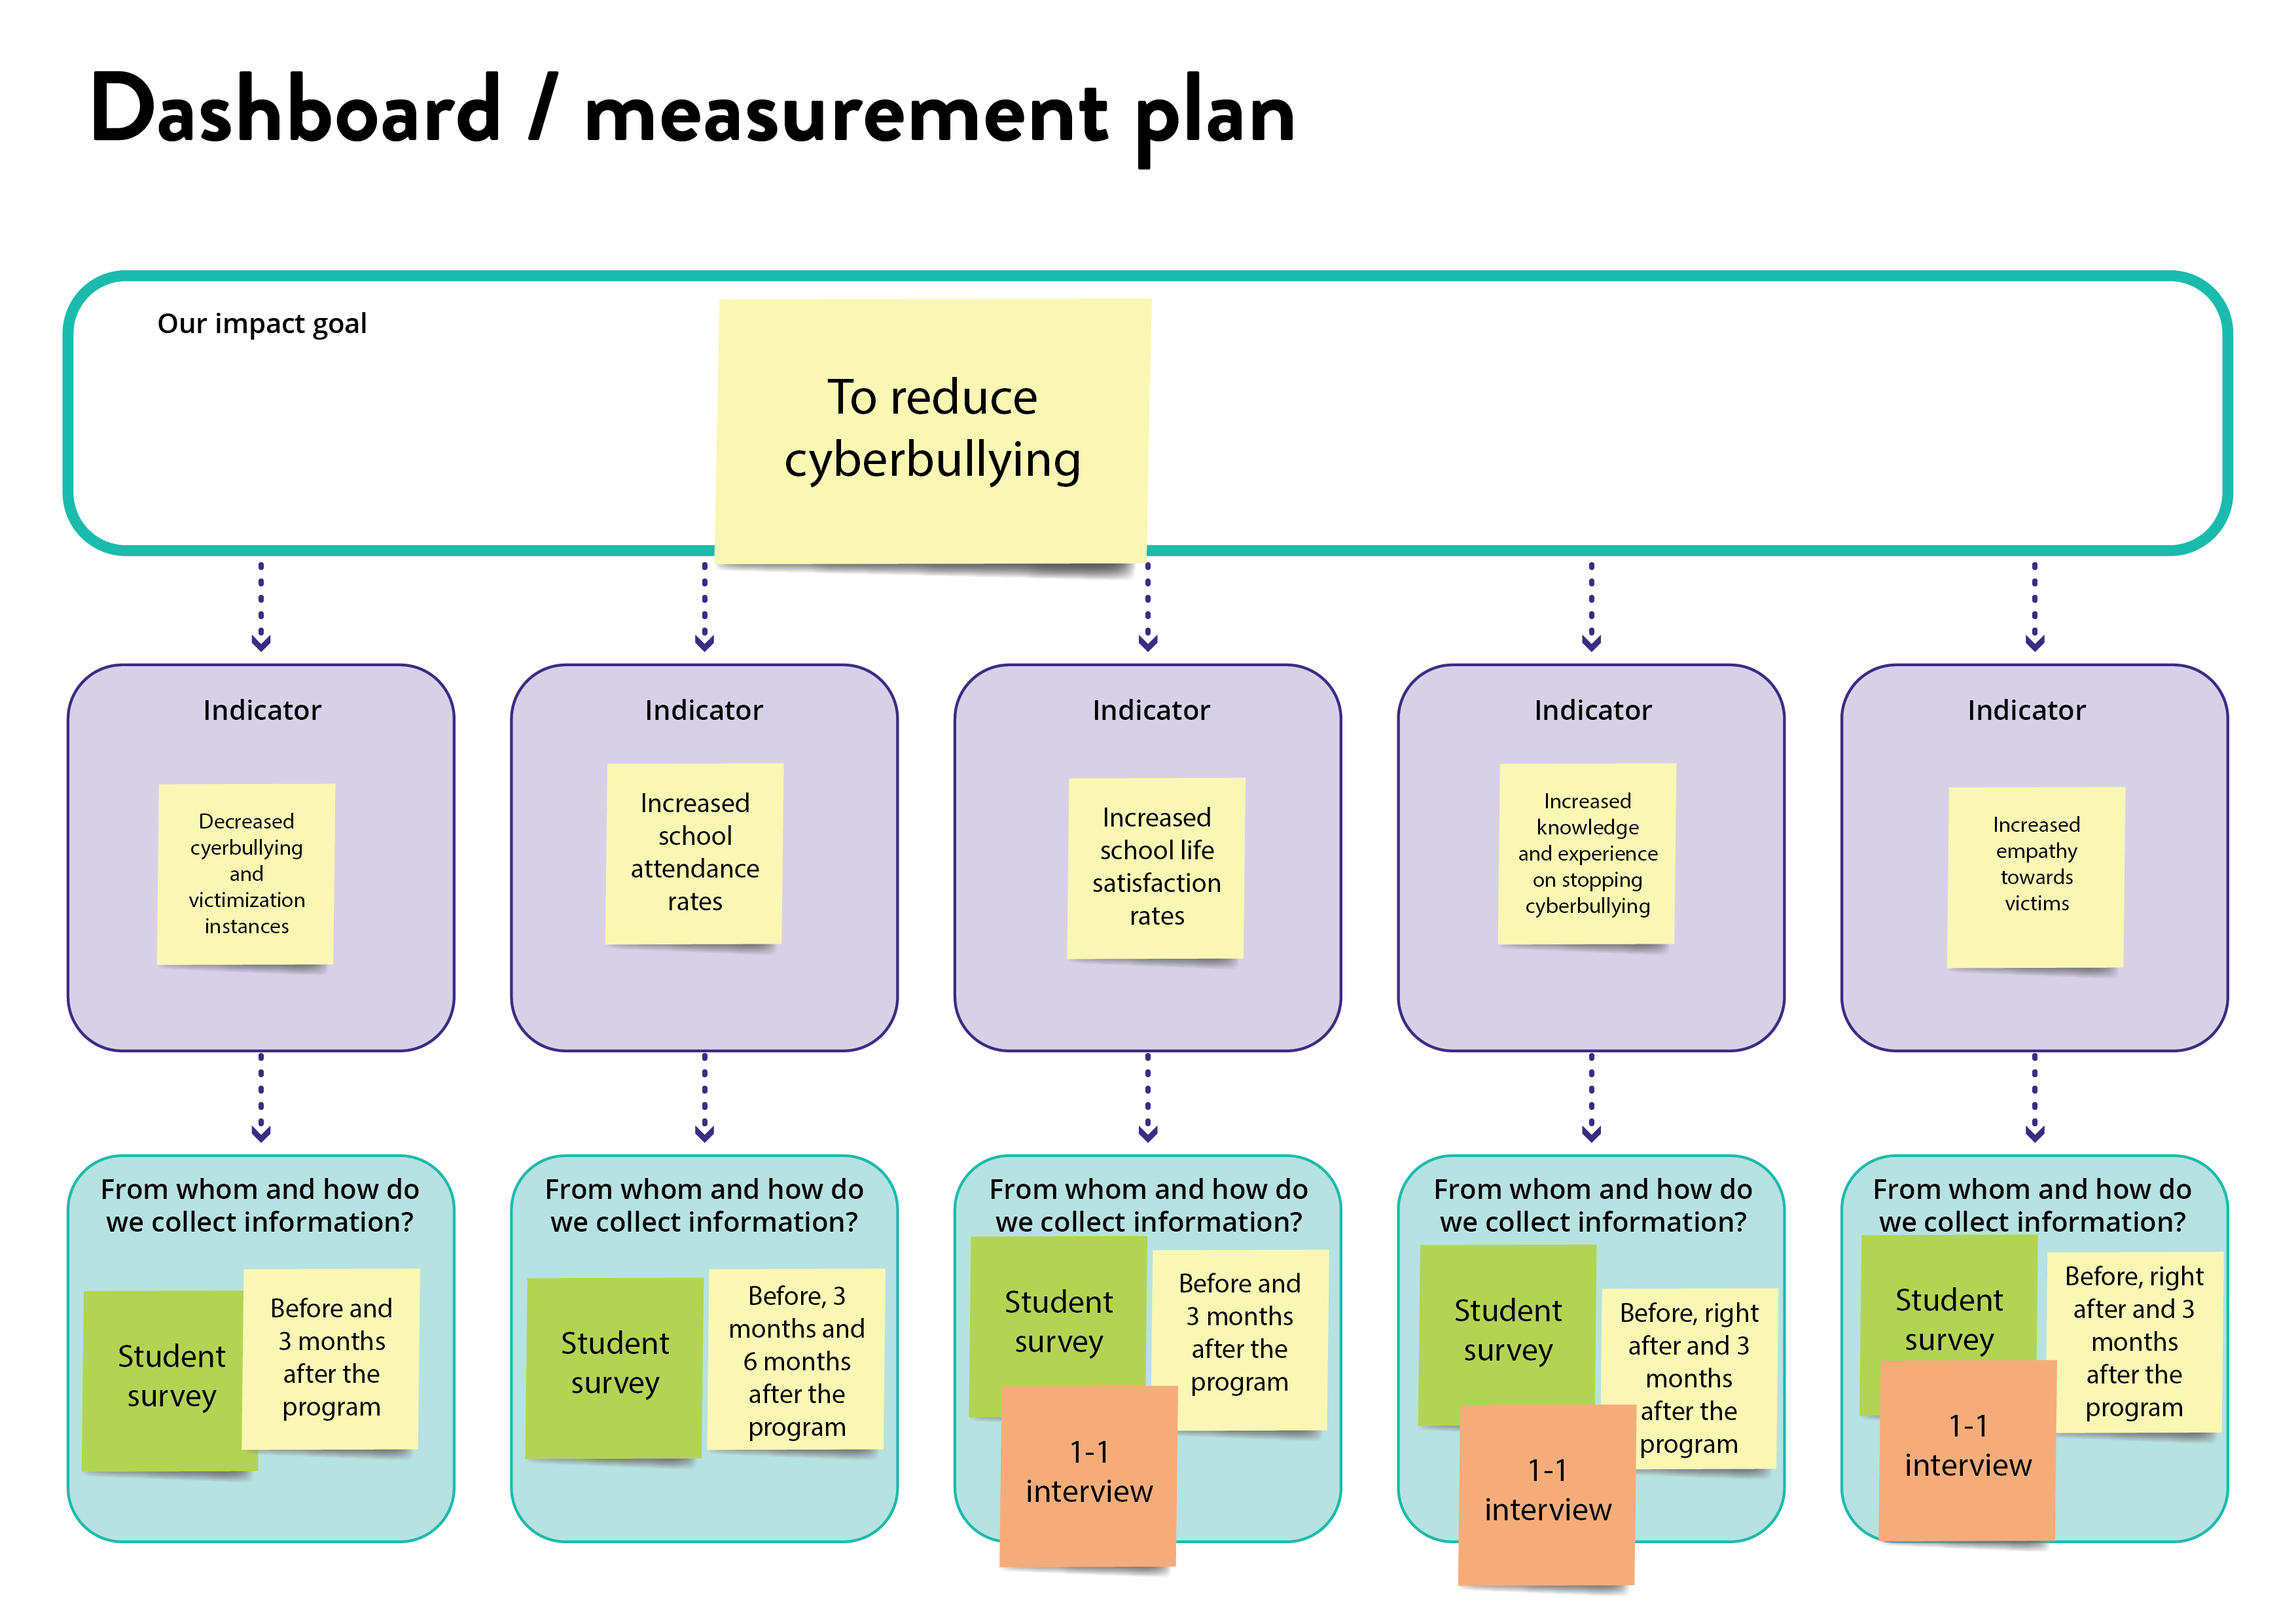
Here is an example about a cyberbullying prevention program.
Why to use it?
☑ To plan data collection and analysis according to each of your impact indicators: who will do what by when.
How to use it?
Integrate planning the measurements with your organisation´s usual planning process. Do not keep it separate because striving for the impact should be the core of your activities.
Use the results, including numbers, stories and insights collected thanks to the measurement process. For example, discuss the findings at your team meetings. And communicate your successes and learnings also to external audiences.